
The effectiveness of infographics
By Jadah Smith
Infographics are a creative way to present valuable information.
According to Shift Disruptive Learning, 90 percent of information absorbed by the brain is visual. So to appeal to the nature of the human brain, presenting information visually is an effective tool in marketing.
If you decide to use more infographics in your communication strategy or are looking to make your next infographic better, defining your goal and audience is paramount to success. Furthermore, understanding the value of color scheme, style and layout in communicating information will allow you to maximize the effectiveness of your next project.
Why is it effective?
According to researchers, visual learners make up 65 percent of the population. Just from this, the effectiveness of representing information visually is clear. Focusing on visual information allows for a more accessible experience that appeals to a wider audience.
Visual information, and infographics more specifically, are easier to understand and motivate the audience to engage more with your content. It makes sense that 74 percent of marketers incorporate visual representations in their online presence. In a marketing strategy, infographics are great tools for effective visual engagement.
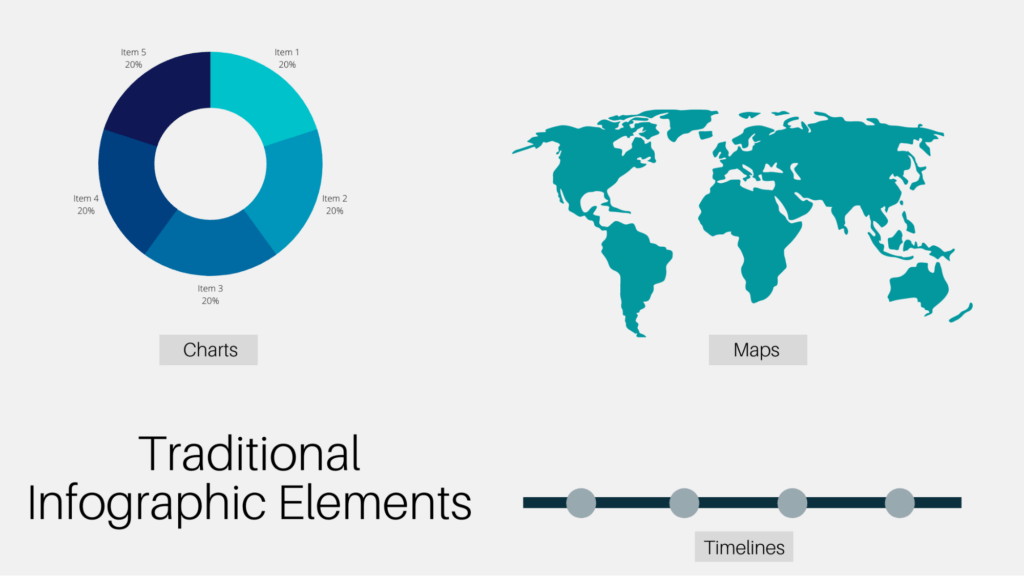
Types of Infographics
Consider what comes to mind when thinking of an infographic. Infographics can look like a lot of things: a poster at work or an image in a textbook. Each different type of infographic highlights a specific purpose:
- Timeline Infographics show visual information on a series of events in chronological order. These are best used when your goal is to show the evolution of an object or the history of an event.
- Anatomy Infographics break down elements of an object in an effort to explain its mechanics and functionality.
- How-To Infographics provide an easy-to-follow blueprint for how to accomplish a specific task.
- List Infographics provide an easy layout for the reader to absorb information. This can be a list of items, ideas or even facts relevant to your infographic topic.
In determining what type of infographic to use, consider your purpose and audience.
Take it Step by Step
Identify the essential information
Think carefully about what information you want your audience to learn about your topic. It is helpful to put your information through three filters:
- What information is essential?
- What is important?
- And what would be nice to have but not essential?
Make sure that, once information has been selected, you provide accurate data and cite any sources.
Determine the visuals that will enhance the information
Once you have determined the critical information to include, put yourself in your audience’s shoes. Thinking about your audience as consumers and considering what will resonate with them goes a long way to finding the right visuals.
Do you have dates or quotes to include? Should you use charts? Percentages? Always consider which of these elements supports the essential messages you want to include in your infographic.
Defining layout and design for skimming, scanning, and consuming
Layout, design and color scheme are all key factors of an infographic.
Think about how your audience consumes information. Will it be in print, on a computer or on a tablet or phone? This can help you make decisions on how much information you are able to provide in the space given. Your goal is always for people to find your content (message) valuable. To achieve that, the visual elements must help in its readability. In considering a good layout, keep it simple. Start by including the basics, then add to it if space allows. Remember, it’s all about balance.
Infographics are a proven tool in marketing, so consider one for your next branding concept, relaunch or project. Contact us to master the art of infographics and take your business to the next level.